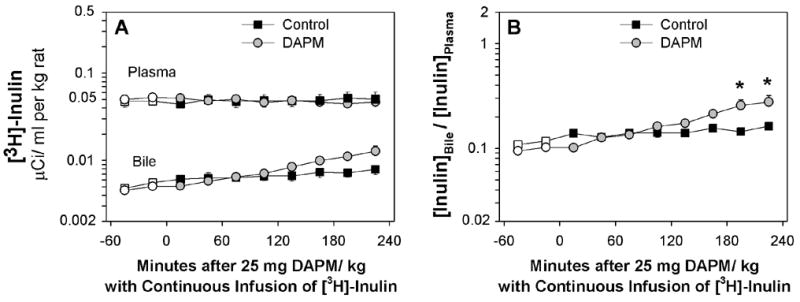
Figure 7.

(A) Time course of changes in [3H]-inulin in plasma and bile and (B) ratio of [3H]-inulin in bile to plasma of control rats and rats treated with 25 mg DAPM/ kg. Values are means ± SE of four control and seven DAPM-treated rats per group. Open symbols represent basal values; symbols without error bars indicate the SE lies within the symbol. Asterisks near symbols of DAPM-treated rats indicate values significantly different from control rats at that time point. * p < 0.05. Note the Y axes are log scale.
