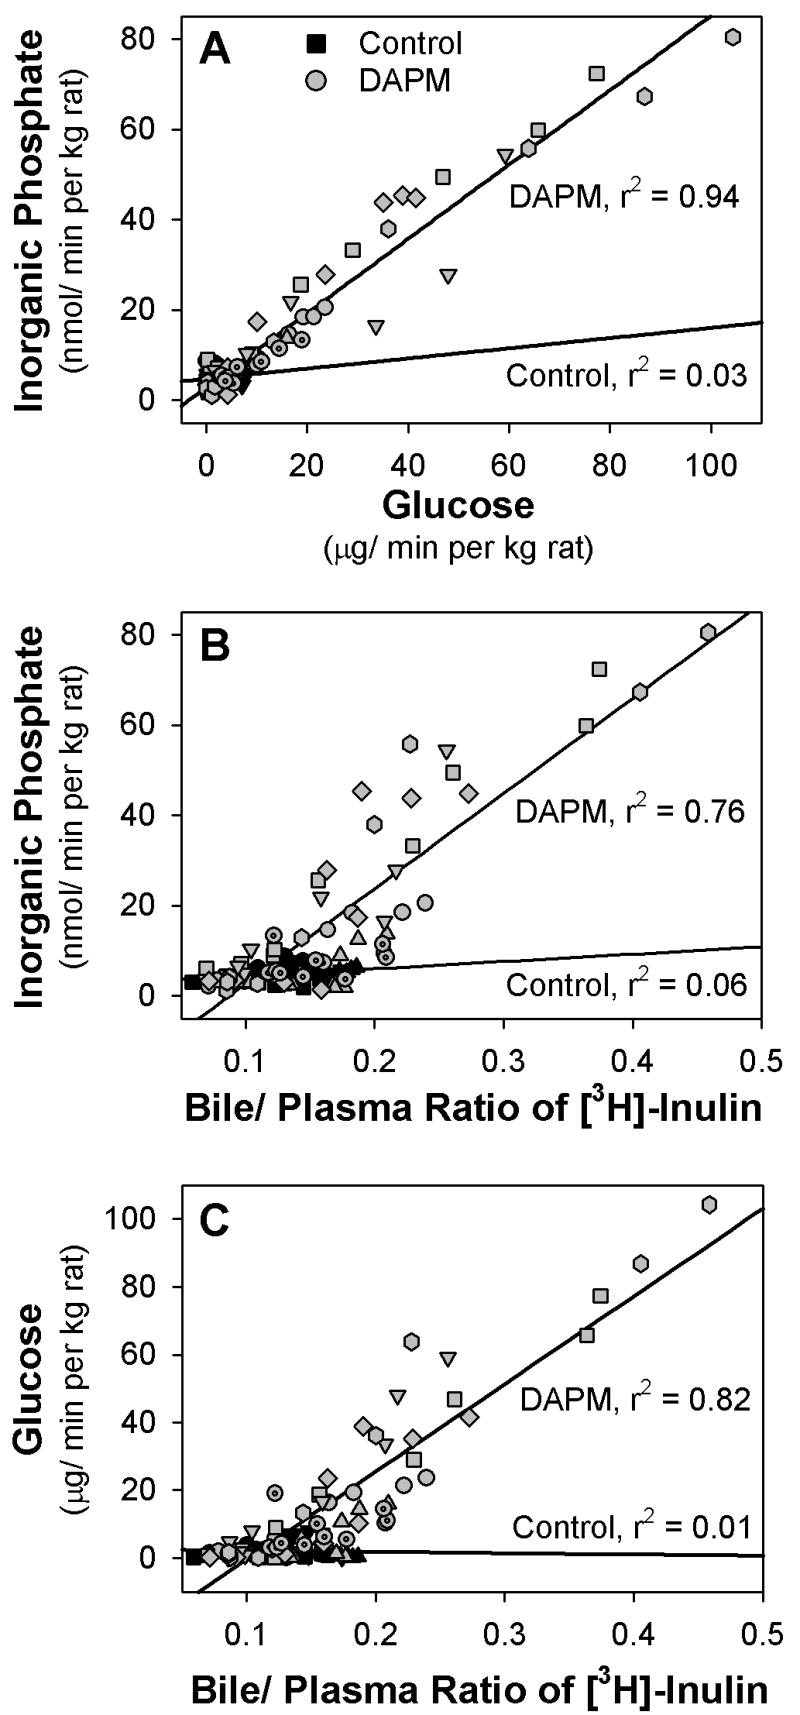
Figure 8.

Linear regression plots of the biliary excretion of (A) inorganic phosphate versus glucose, (B) inorganic phosphate versus B:P ratio of inulin, and (C) glucose versus B:P ratio of inulin in 4 control rats (black symbols) and 7 rats treated with 25 mg DAPM/ kg (gray symbols). Each symbol shape represents the values from one rat.
