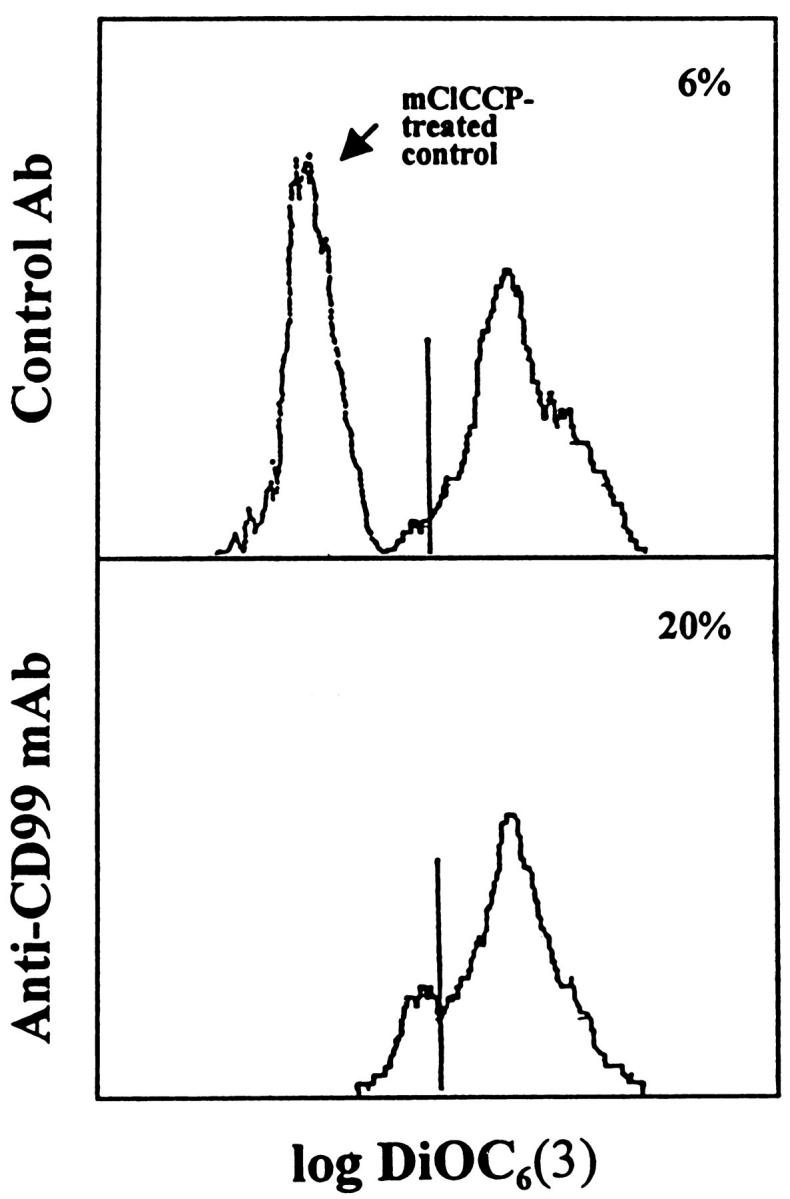
Figure 9.

Reduction in the ΔΨm of RD-ES cells after induction of CD99-mediated apoptosis. RD-ES cells were incubated with control Ab (top) or anti-CD99 MAb (bottom) for 2 hours and stained with DiOC6(3). After staining, flow cytometric analysis was performed. Negative control (mClCCP-treated cells) is shown in the upper panel . The numbers indicate percentages of DiOC6(3)low cells among the viable fraction of cells as determined by FSC and SSC. Data are representative of three different experiments.
