
Figure 7.
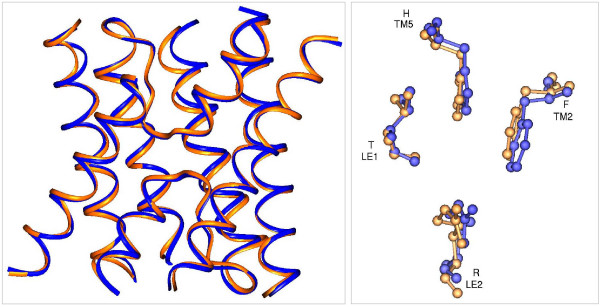
Comparison of X-ray and model structures of SoPIP2;1. Homology model generated for SoPIP2;1 is superposed on the experimentally determined structure of SoPIP2;1. Left: Only the transmembrane helical regions and the loops B and E are shown. Right: Residues forming the Ar/R selectivity filters of modeled and the X-ray structures are shown after superposition in ball-and-stick representation. The transmembrane segments and the loop regions to which these residues belong are indicated. There is an excellent agreement between the modeled and the X-ray structures in the transmembrane region.