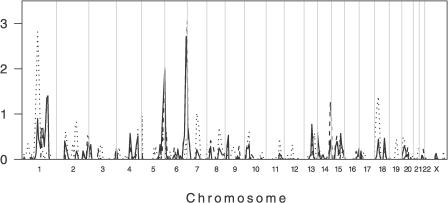
Figure 2. Primary Genome-wide Linkage Scan of 219 Individuals Belonging to 38 Extended Multicase Pedigrees from Sudan.
Dotted and dashed lines show the data stratified by Um-Salala and El-Rugab, respectively. The solid line represents the combined analysis across both villages. Multipoint LOD scores (plotted as sign(dhat)•LOD [36]) are shown on the vertical axis and the distance in cM (Genethon Map) from the p terminus for all chromosomes on the horizontal axis. As a guide to evaluating significance of genome-wide data, Lander and Kruglyak [14] propose threshold point-wise LOD scores of 2.2 (nominal p value 7.4 × 10⁻⁴) for “suggestive linkage” and 3.6 (p = 2.2 × 10⁻⁵) for “significant linkage.” Refined mapping reduced evidence for linkage on Chromosome 5 and eliminated evidence for linkage on Chromosome 13 (data not shown). In addition to the major village-specific peaks of linkage on Chromosomes 1 and 6 (cf. main text), evidence for novel village-specific regions of linkage (at p < 0.01) not seen in the unstratified analysis of the original primary genome scan data was also obtained at Chromosomes 14q32.2 (D14S65; LOD score 1.26; p = 0.008) for El-Rugab, and 18p11.22 (D18S464 ; LOD score 1.38; p = 0.005) for Um-Salala. Refined mapping reduced evidence for linkage on Chromosome 14 and eliminated evidence for linkage on Chromosome 18 (data not shown). Evidence for village-specific linkage was also observed at D2S142 (LOD score 0.82; p = 0.026) for Um-Salala. We added more markers in this region because it coincided precisely with a second peak of linkage (LOD score 2.29; p = 5.86 × 10⁻⁴) reported by Bucheton et al. [13] for Aringa families negative for linkage at D22S280 on 22q12, providing further support for village- and possibly lineage-specific effects (cf. main text). In Um-Salala, the evidence for linkage to 2q23-q24 was retained (LOD score 0.92; p = 0.02) on refined mapping, but the peak of linkage moved 7 cM proximal to marker D2S2275. After we had demonstrated the influence of stratifying analysis by Y chromosome haplotype on village-specific peaks at 1p22 (cf. Figure 3) and 6q27 (cf. Figure 4), we went back and analysed the primary genome scan data across both villages stratifying by Y chromosome haplotype. No novel peaks for either E3b1 or A3b2 families analysed across both villages were observed (data not shown).

