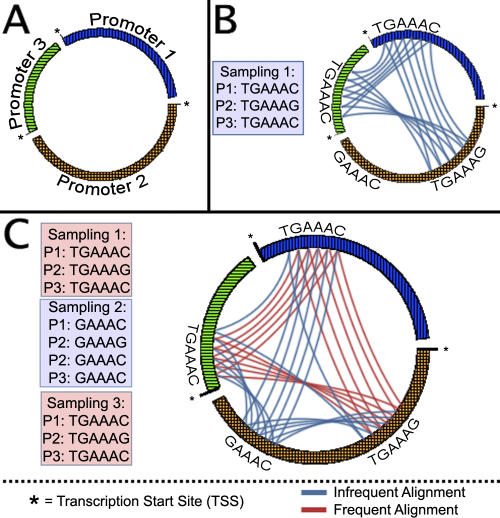
Figure 1. BSG Construction.
(A) Vertices of the BSG represent nucleotides in input promoters. Here, the input nucleotides are represented as points along the perimeter of a circle. Each disconnected bar along the perimeter of the circle represents a single promoter, with the transcription start site indicated.
(B) Edges (arcs across the circle) are added to each pair of aligned nucleotides in a motif resulting from a single Gibbs sampling prediction.
(C) Edges are compiled across ensemble Gibbs sampling results. Recurring edges are weighted by the number of times they recur, as indicated by different colored arcs in the BSG. Once all edges are collected from ensemble Gibbs sampling results, edge weights are normalized by the most frequently recurring edge.

