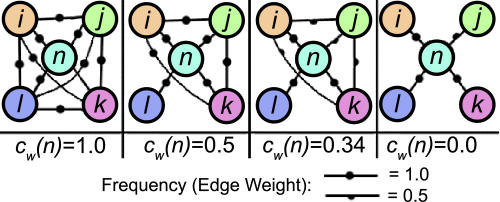
Figure 2. An Illustration of the Weighted Clustering Coefficient: Behavior of the Weighted Clustering Coefficient of Vertex n Is Shown across Four Increasingly Sparse Graphs.
(A) In the most dense case, each pair of vertices adjacent to n is also adjacent, and all edge weights are maximal. Thus, n participates in a maximally weighted clique, and the weighted clustering coefficient is 1.
(B) As edges are removed from the clique, the neighborhood of n becomes less well-connected, and the clustering coefficient decreases.
(C) Unlike the original definition of clustering coefficient, the weighted clustering coefficient responds to the decreased intensity of the cluster resulting from intermediately weighted edges.
(D) Finally, when no edges exist between neighbors of n, the clustering coefficient goes to 0.

