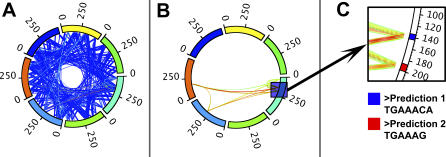
Figure 3. Predicting TFBS within the BSG Framework.
(A) First, a BSG is constructed from ensemble Gibbs Sampling. Here, the perimeter of the circle represents promoters, and lines between nucleotides in the promoters correspond to edges in the BSG. Edges are heat-mapped according to edge weight.
(B) The filtered BSG, obtained by selecting an edge-weight threshold ρ to maximize the BSGscore, followed by all edges with weight less than ρ from the graph.
(C) Final TFBS predictions are made from the filtered BSG by collecting nucleotides contiguous in the original promoters into prediction sequences, which are returned in fasta format. The promoter region depicted contains two predicted TFBS.

