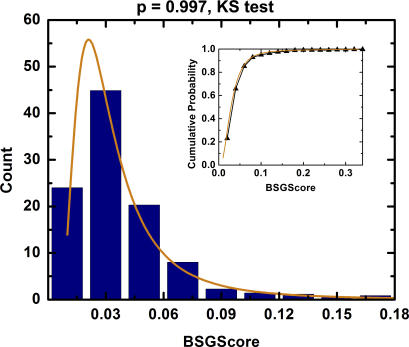
Figure 4. Frequency (y-Axis) of BSGscores (x-Axis) for Set of 7–30 Randomly Selected Yeast Promoters (Blue Bars) Compared with the Probability Distribution of the Estimated Generalized Extreme Value Distribution (Orange Line).
Empirical and estimated cumulative probability distribution (black triangles and orange line, respectively) are shown in the inset. The empirical and estimated distributions are the same with p = 0.997 according to a KS test.

