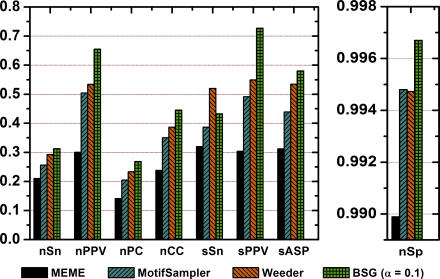
Figure 6. Benchmarked Evaluation of BSG Binding Site Predictions for Yeast Datasets from Tompa et al. [13].
Performance of BSG predictions are compared with the three best-performing algorithms according to a previously published evaluation. Performance measures (x-axis) are nSn (nucleotide sensitivity), nPPV (nucleotide positive predictive value), nPC (nucleotide performance coefficient), nCC (nucleotide correlation coefficient), sSn (site sensitivity), sPPV (site positive predictive value), and sASP (average site performance). For formulas used to calculate these measures, see Materials and Methods. BSGs significantly outperform all previous evaluated algorithms in nearly every measure. Most notable are improvements in nucleotide and site positive predictive value, where predictions from BSGs achieve values of 0.71 and 0.77, respectively.

