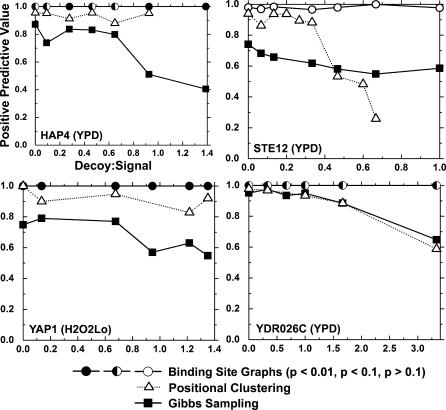
Figure 7. Comparison of Robustness to Noisy Decoy Promoters between BSG Predictions, Positional Clustering [25], and an Equivalent Amount of Gibbs Sampling Runs (6,656 Gibbs Sampling Predictions).
For each of the signal sets, varying numbers of random S. cerevisiae promoters were added to the original ChIP–chip derived set (x-axis). TFBS predictions were made using BSGs (circles), positional clustering (triangles), and the best predictions from an equivalent number of iterations of Gibbs sampling alone (squares). For each set of predictions, the PPV (y-axis) was calculated by comparing the prediction with published motifs as described in Methods. For BSG predictions, filled, half-filled, and open circles represent p < 0.01, p < 0.1, and p > 0.1, respectively. BSGs attain dramatically higher PPV than Gibbs sampling alone, especially in the noisiest input sets. In some cases, the PPV does not decrease monotonically with the addition of noise. This effect is the result of spurious instances of the binding site occurring in the decoy promoters. Although STE12 predictions are not significant, the well-known motif is almost always discovered. In all STE12 predictions, multiple components were identified in the BSG, highlighting the need to generalize the p-value to graphs with multiple motifs.

