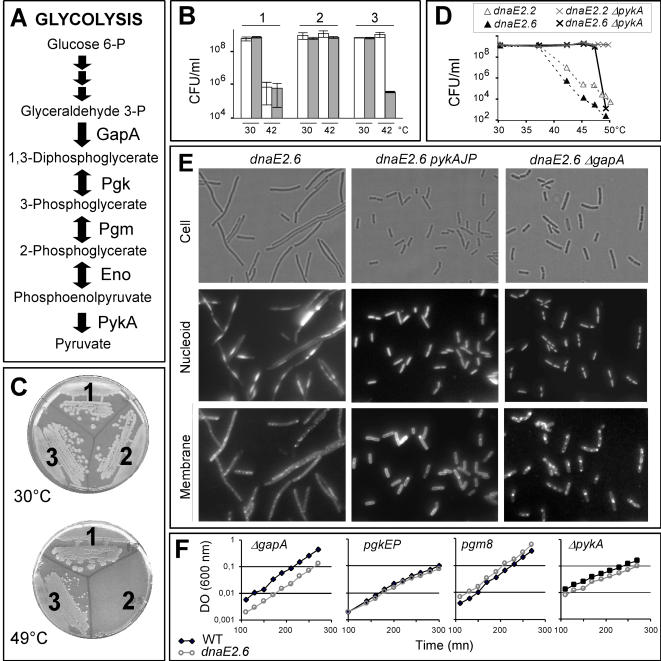
Figure 1. Glycolytic mutations suppress dnaE(Ts) mutants.
(A) Schematic representation of glycolysis. GapA: glyceraldehyde 3-phosphate dehydrogenase; Pgk: phosphoglycerate kinase; Pgm: phosphoglycerate mutase; Eno: enolase; PykA: pyruvate kinase. (B) Complementation assay. The dnaE2.6 (1), dnaE2.6 pgm8 (2) and dnaE2.6 pgm8 pgmind (3) strains were grown in LB at 30°C and plated on the same broth containing (grey bars) or not (white bars) 0.5% of xylose (the WT copy of pgm in strain 3 was expressed from a promoter induced by xylose). Upon incubation at permissive or restrictive temperatures, the concentration of cell forming unit (CFU/mL) was determined. (C–E) Growth of Ts and suppressed strains at various temperatures was analyzed by streaking (C; 1: WT TF8A strain; 2: dnaE2.10; 3: dnaE2.10 pgm25), plating (D) and optical microscopy after 2h of growth at 42°C (E). Cell pictures are as follows: cell: bright font; nucleoid: DAPI staining; membrane: FM5-95 staining. (F) Growth of four different dnaE2.6 suppressed strains and the corresponding metabolic mutants at restrictive temperature (40°C) in LB liquid broth (followed by measurement of optical density).

