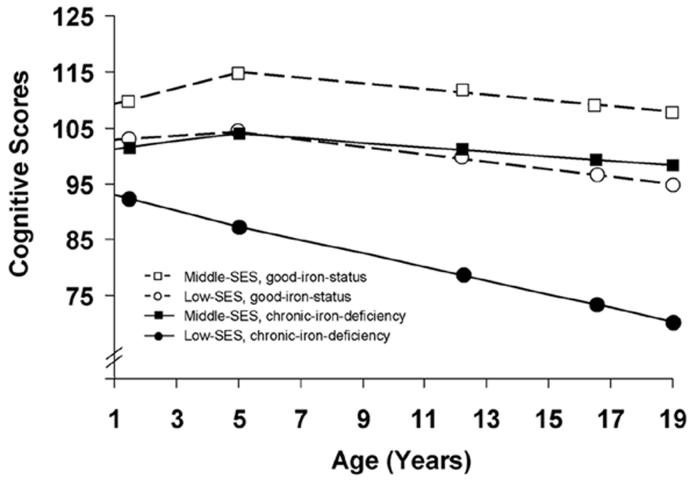
Figure 2.
Cognitive composite scores over time, comparing infant iron status groups within middle and low socio-economic status (SES) families. Iron status group and SES level each affected initial scores (P values < .01). Change over time differed only for the chronic-iron-deficiency group in low-SES families (P < .05). Each participant is represented once: good iron status (n = 67) compared to chronic iron deficiency (n = 20) in middle-SES families and good iron status (n = 65) compared to chronic iron deficiency (n = 33) in low-SES families. Symbols are placed at the average age for each assessment.

