
Fig. 2. Genomic dCMP methylation.
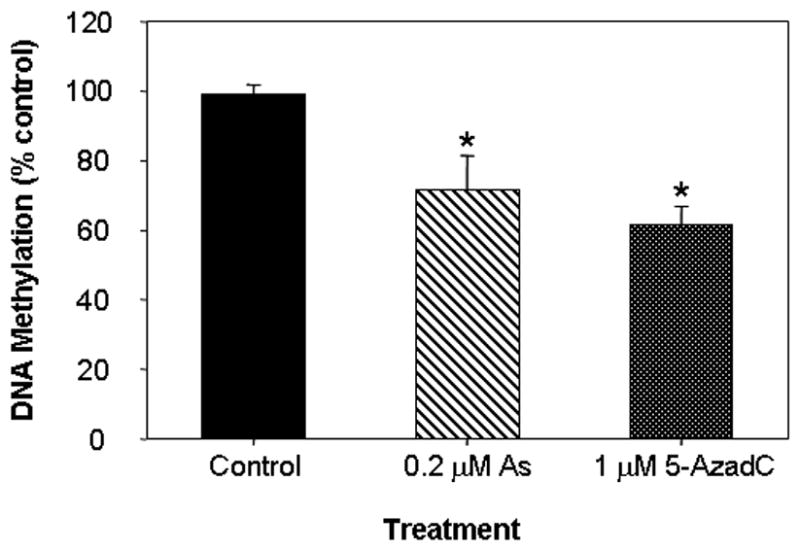
HaCaT cells were cultured with 0.2 μM arsenic for 10 passages or cultured in the presence of 5-azadeoxycytidine for 1 passage. Levels of genomic 5-methyl-dCMP were calculated as the fraction of total dCMP (5me-dCMP/(5me-dCMP+dCMP) and expressed relative to untreated control levels. The asterisk denotes significant differences from control (p<0.05) by one-way ANOVA.