
Figure 5.
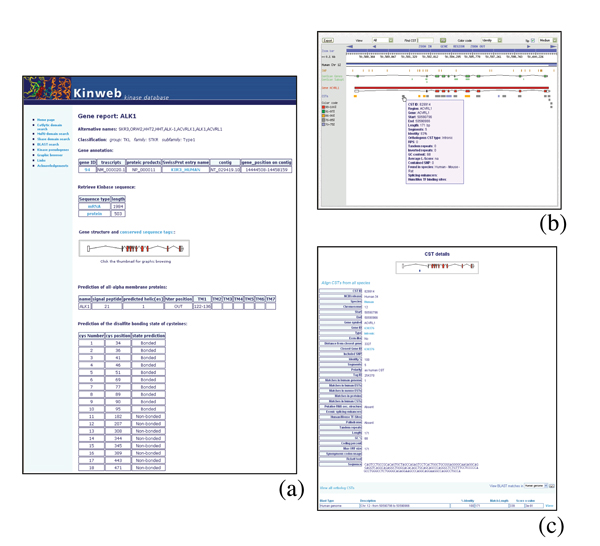
Annotations available for each kinase gene. (a) The "Gene Report" page shows gene annotations extracted from public databases, the results of predictions for transmembrane domains and Cys disulfide bonding state and links the identified CSTs to the graphical representation of the gene. (b) Graphical representation of the gene and related transcripts and CSTs. Details are shown for the CTS under the mouse pointer. CSTs are color-coded based on degree of conservation. (c) The CST details page, where full details of the selected CST are shown, including the results of BLAST searches.