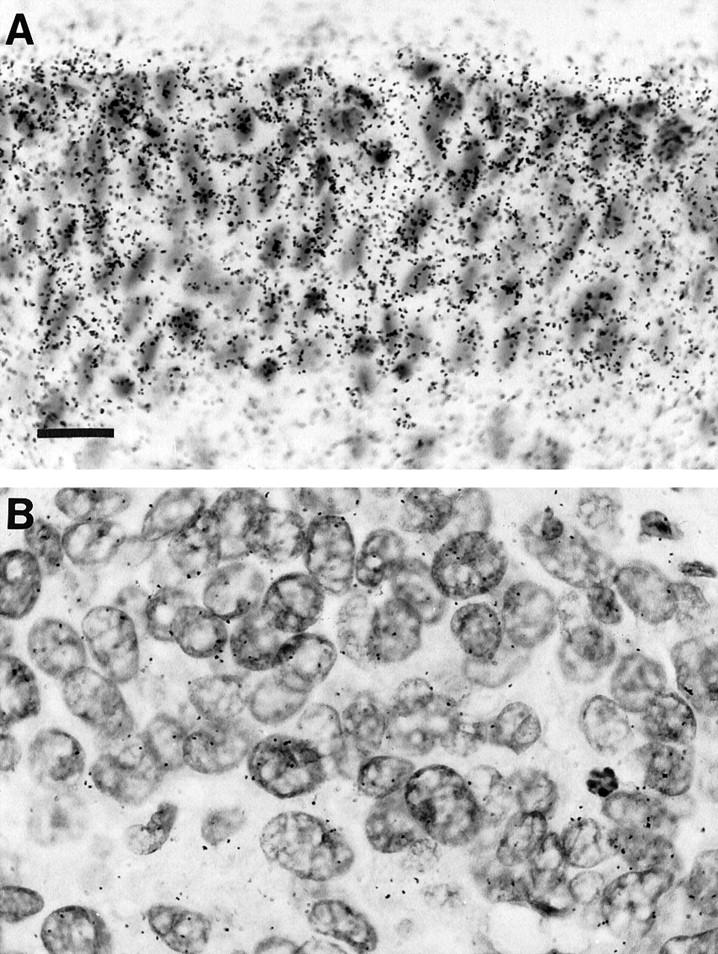
Figure 2.

NF1 gene expression in grade 3 urinary bladder transitional cell carcinoma, as visualized by in situ hybridization. A: Normal urinary bladder epithelium. B: Area of carcinoma within the same tissue section. The tissue specimen is the same as in Figure 1B ▶ (T27 in Table 1 ▶ ). Radioactively labeled cRNA-mRNA hybrids were detected by autoradiography. The autoradiographic grains were quantitated using MDID-M4 image analysis software (see Results). Hematoxylin counterstain; magnification, ×50; scale bar, 15 μm.
