
Figure 2.
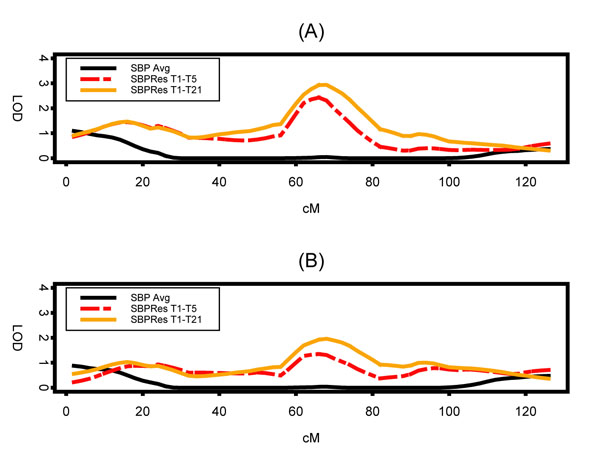
Two multipoint LOD scores plots using the residuals approach on chromosome 17 for three different analyses: using all 21 time points from Cohort 1 and all 5 time points from Cohort 2, only the concordant five time points from Cohorts 1 and 2, and the average SBP over all measurements for each subject: with age restriction from 25 to 75 (A), and using all ages (B).