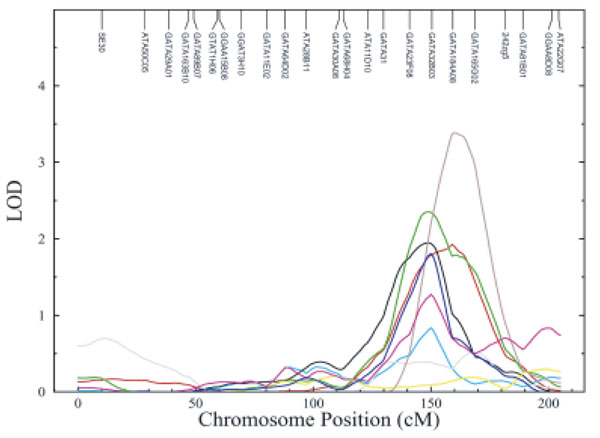
Figure 2.

Multipoint LOD plot for the factors and individual traits on chromosome 6 Line colors: BMI-GLUC-SBP factor (red), HDL-TG factor (blue), TC-TG factor (pink), BMI (brown), GLUC (gray), SBP (yellow), HDL (black), TC (turquoise), and TG (green).
