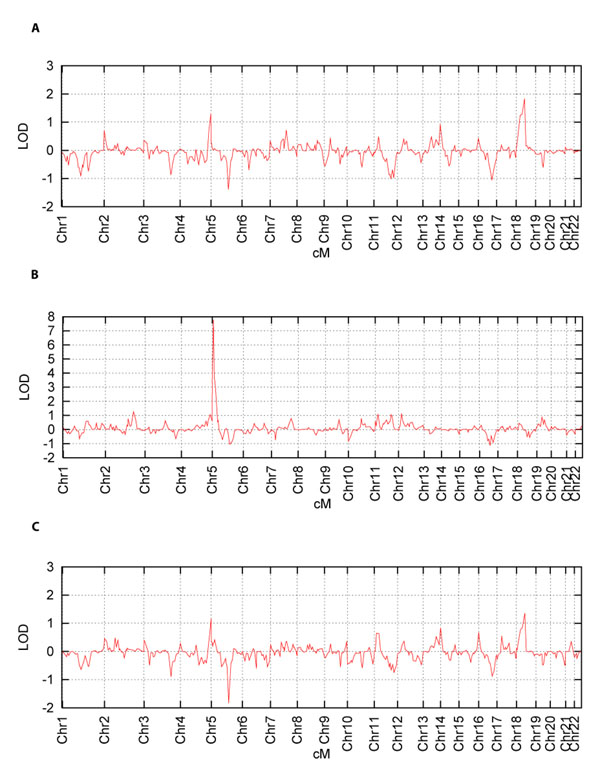
Figure 2.

Genome scan LOD plots of fasting triglycerides in Cohort 1 (first measurement) (A), Cohort 1 (first measurement EBV) (B), and Cohorts 1 and 2 (pooled) (C)

Genome scan LOD plots of fasting triglycerides in Cohort 1 (first measurement) (A), Cohort 1 (first measurement EBV) (B), and Cohorts 1 and 2 (pooled) (C)