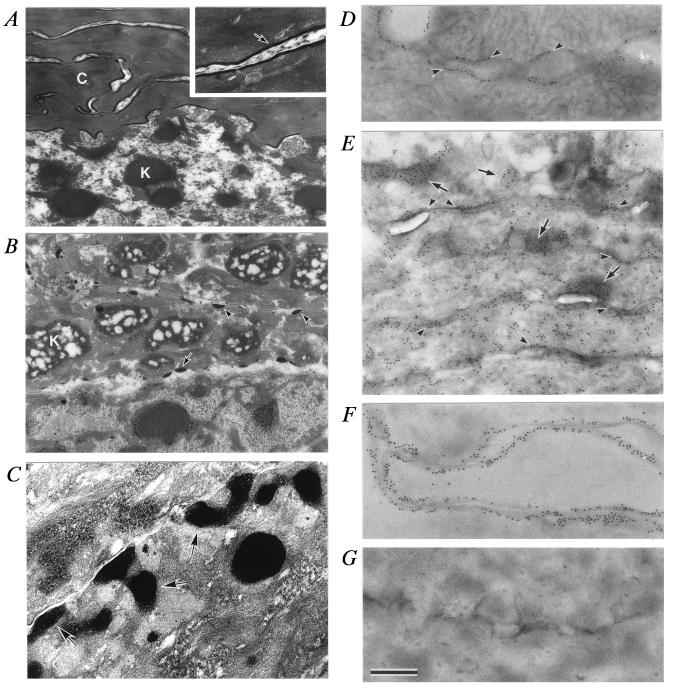
Figure 4.
Ultrastructure of TGase 1−/− epidermis. Sections of normal (A, D, and F) and TGase1−/− (B, C, E, and G) mouse epidermis (18.5 dpc). C in A, cornified cell; arrow in the Inset of A, cell envelope; K in A, keratohyalin F-granule in the stratum granulosum; K in B, a swollen keratohyalin F-granule; arrows in B and C), abnormal electron-dense aggregates adherent or close to the plasma membrane. (D–G) Section of stratum corneum labeled with anti-loricrin antibody and 10 nm gold. Arrowheads in D, cell envelope; arrows in E, abnormal electron-dense aggregates; arrowheads in E, cell membrane. (F and G) Sections digested with proteases. (×12,200 in A and B; ×28,400 in the Inset of A and in C; ×19,500 in D–G. Bar, 0.8 μm in A and B; 0.34 μm in the Inset of A and in C; 0.5 μm in D–G.)

