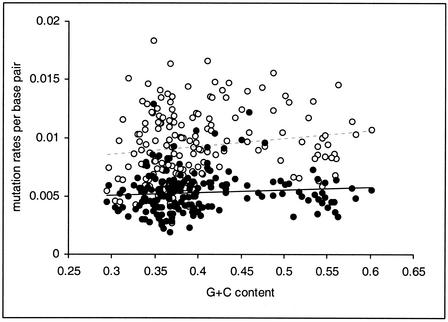
Figure 5.
Mutation rates per base pair against G+C content for GC→AT (open circles) and AT→GC (closed circles) mutations. Data points represent nonoverlapping 5-kb blocks of intronic and intergenic sequence, with human and chimpanzee lineage-specific substitutions summed. The lines give linear regressions (dashed for GC→AT, solid for AT→GC).

