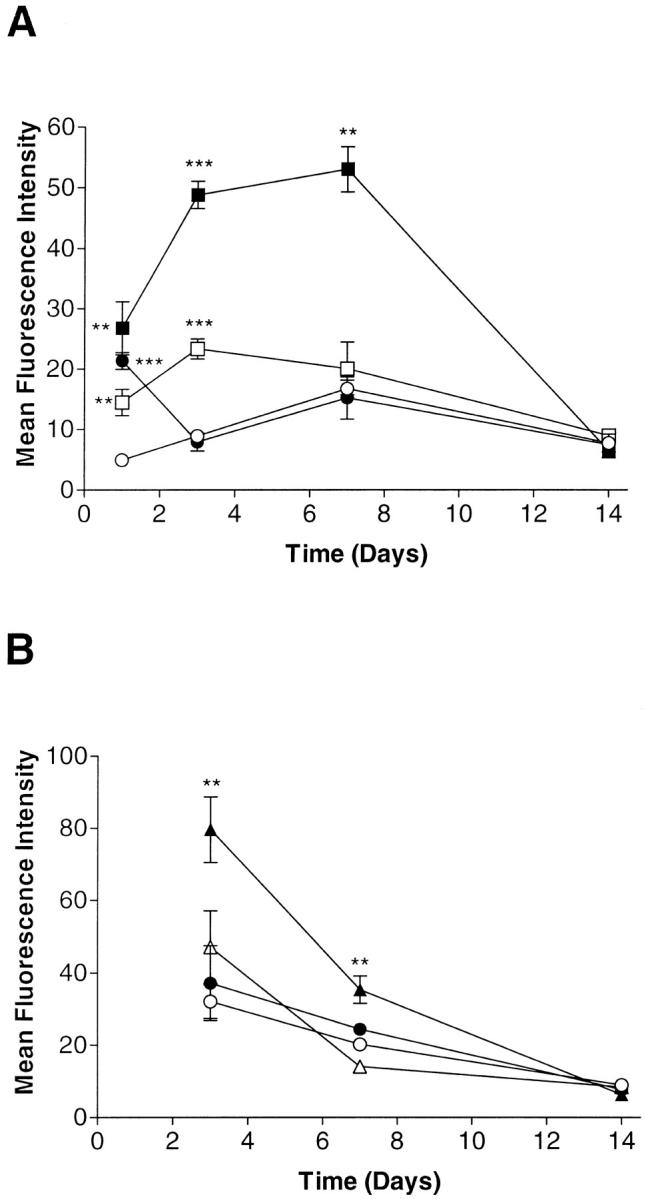
Figure 5.

Time course of VCAM-1 expression in fibroblast-like synoviocytes treated with a single application of IL-4 (A) and IL-13 (B). Cells were cultured with either medium only (open circles), TNF-α (10 ng/ml) (closed circles), IL-4 (10 ng/ml) (open squares), IL-4 plus TNF-α (both at 10 ng/ml) (closed squares) , IL-13 (10 ng/ml) (open triangles), or IL-13 plus TNF-α (both at 10 ng/ml) (closed triangles). Cell surface VCAM-1 expression was analyzed at days 1, 3, 7, and 14 by flow cytometry using mAb BBA-5. Samples were analyzed using a FACScan and the results expressed as corrected MFI. Data are presented as the mean ± SE of four or five experiments. *, P < 0.05; **, P < 0.01; ***, P < 0.001 (compared with medium-only control at the respective time point).
