
Figure 1.
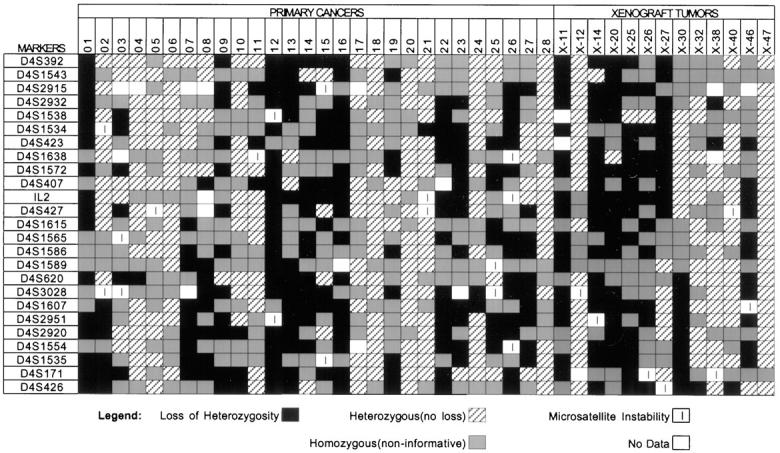
Results of microsatellite LOH analysis. The microsatellite markers are listed in the right hand column in sequential order, with the marker most proximal to the centromere (D4S392) on top. The results of the primary cancer cases (designated by number) are listed on the left 28 columns. The results of the xenograft tumors (designated with an X) are listed in the right 13 columns.