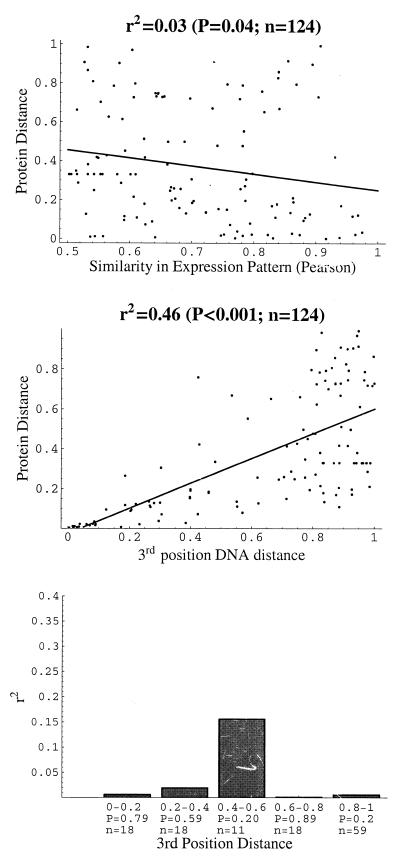
Figure 2.
(a) Similarity in gene expression pattern vs. amino acid distance da for 124 conserved gene pairs with protein distance 0<da<1, third position codon distance 0<d3<1, and Pearson correlation coefficient of mRNA induction level r > 0.5. Significance of the calculated coefficient of determination r2 = 0.03 was determined by a randomization assay. (b) Third position nucleotide distance d3 vs. protein distance da for the 124 genes pairs shown in a. (c) Coefficient of determination r2 between protein distances and similarity in expression pattern, calculated for groups of gene pairs with third position distances within a specified range, as shown on the x axis. Numbers of gene pairs in each distance group and P value indicating whether the estimated r2 is significantly different from 0 are shown on the x axis as well. P values were determined by a randomization assay.

