


Figure 7.
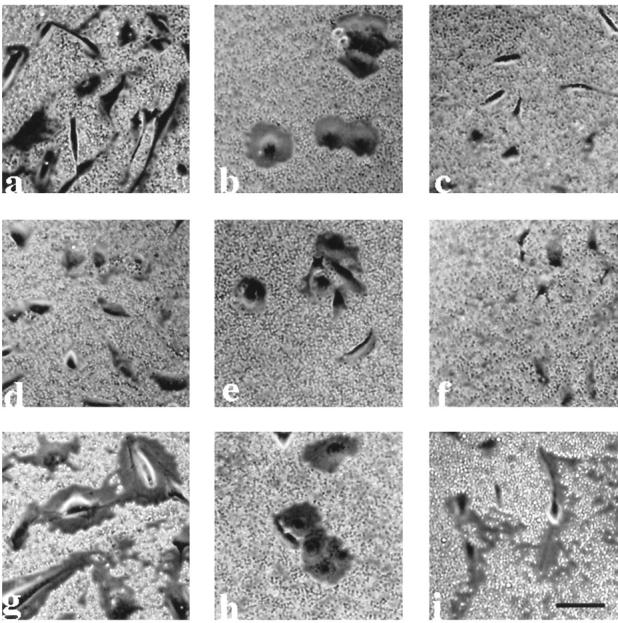
Visualization of the pericellular matrix on LP9 mesothelial cells, NIH:OVCAR5 cells, and SKOV3 cells. LP9 cells (a, d, and g), NIH:OVCAR5 cells (b, e, and h), and SKOV3 cells (c, f, and i) were seeded at a low density and then cultured for 24 hours. The pericellular matrix was visualized by the particle exclusion assay using fixed goat RBCs as described in Materials and Methods. Cells were incubated in the assay buffer for 1 hour before adding the RBCs (a to c) or treated with either 80 U/ml bovine testicular hyaluronidase (d to f) or 2 mg/ml RCS-PG (g to i). Bar, 21 μm.