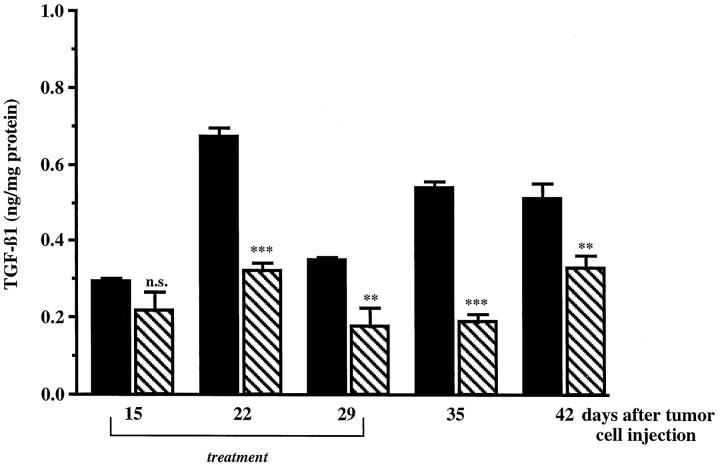
Figure 2.
Concentration of TGF-β1 in tumor nodules from rats treated or not with the lipid A during tumor development. Rats were injected i.p. with PROb tumor cells at day 0 and treated (▧) or not (▪) with OM 174. Tumor nodules were taken from rats of both groups on days 15, 22, 29, 35, and 42 after the tumor cell injection, homogenized in an extraction buffer, and centrifuged. The total TGF-β1 concentration of the supernatants was measured by the ELISA method. The statistical analysis was performed using Student’s t-test (n.s., not significant; **, P ≤ 0.01; ***, P ≤ 0.001). One of three representative experiments is shown.

