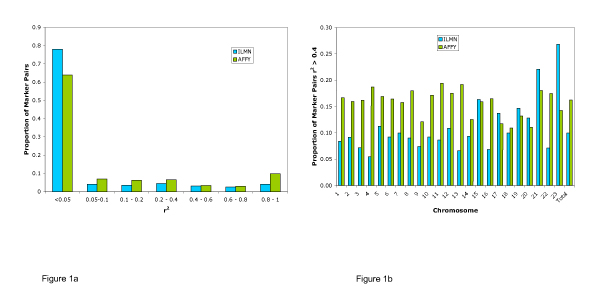
Figure 1.

LD strength in the Illumina Linkage III SNP panel (ILMN) and the Affymetrix 10 k mapping array (AFFY). a) Distribution of marker pairs by LD strength (r2); b) Proportion of marker pairs r2 > 0.4 by chromosome (chromosome 23 = X chromosome).
