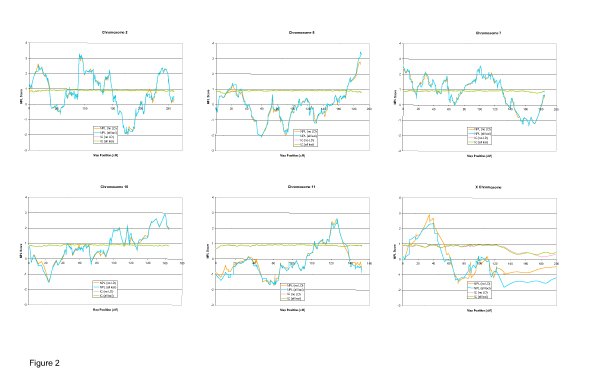
Figure 2.

Multipoint NPL analysis of ALDX1 phenotype using the Illumina III SNP linkage panel. Multipoint NPL scores across the entire chromosome for all SNPs (blue line) and a subset of SNPs with weak or no LD (orange line) are shown for the six chromosomes that have regions with corresponding p-values < 0.01. In addition, the information content (IC) curves are also shown for all loci (green line) and the subset of SNPs with weak or no LD (pink line).
