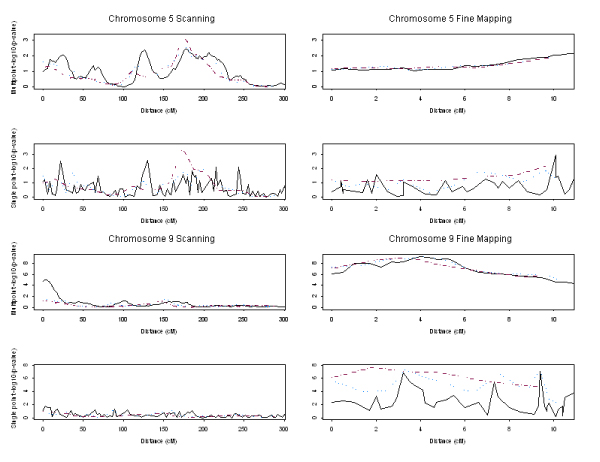
Figure 1.

Single-point and multipoint linkage signals by Haseman-Elston regression. Scanning indicates using the map of SNPs ~3 cM apart; fine mapping indicates using the map of SNPs ~0.3 cM apart. Solid line: single SNP as a marker; dotted line: 3 SNPs in a cluster; dashed line: 5 SNPs in a cluster.
