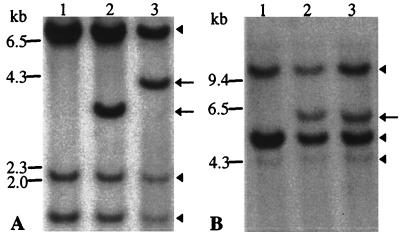
Figure 1.
Southern analysis of the PDGF-B gene integration in HaCaT cells. Genomic DNA was digested with (A) BamHI or (B) HindIII. Three bands of identical pattern in each lane (arrowheads), correspond to the endogenous PDGF-B gene. An additional band in lanes 2 and 3 (arrows) represents the incorporated gene. Lanes: 1, HaCaT/neo; 2, HaCaT/PDGF-B/cl.17; 3, HaCaT/PDGF-B/cl.18.

