
Figure 3.
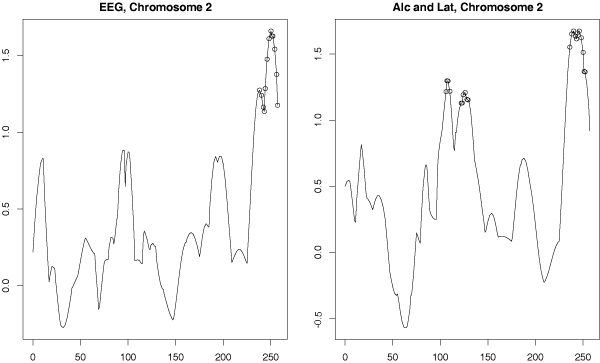
Linkage analysis of principal component phenotypes. SIBPAL linkage analysis on chromosome 2 using only STR data. Outcome variables are the first principal components calculated from, respectively: all 13 EEG (electrophysiological) variables; both alcoholism definitions and all latent variables. Y-axis is the value of the Haseman-Elston regression coefficient. Significant values are indicated with circles.