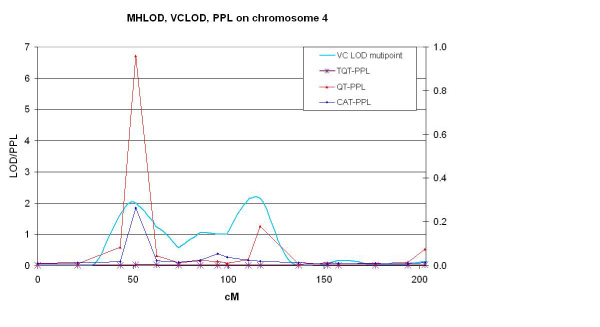
Figure 1.

Summary of PPL and VC analyses. The LOD scale is on the left and the probability scale is on the right, however there is no direct way to equate values from the 2 scales. Note that PPL values are based on 2-point likelihoods. The data points are connected only for ease of reading.
