
Figure 3.
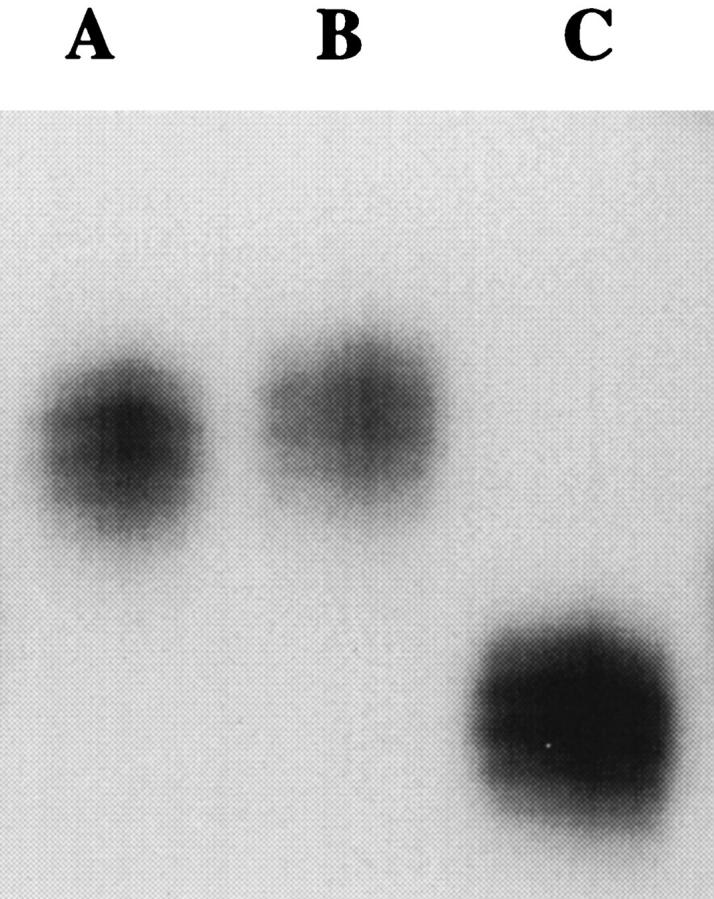
Results from the amplification of BAT-25 from the lymphocyte DNA from three Nigerians. The banding patterns seen in Lanes A and B demonstrate the range of size previously characterized for the BAT-25 locus at both alleles. Lane C demonstrates the banding pattern seen in one sample from a Nigerian patient with two polymorphic BAT-25 alleles, both with reduced mononucleotide tracts.