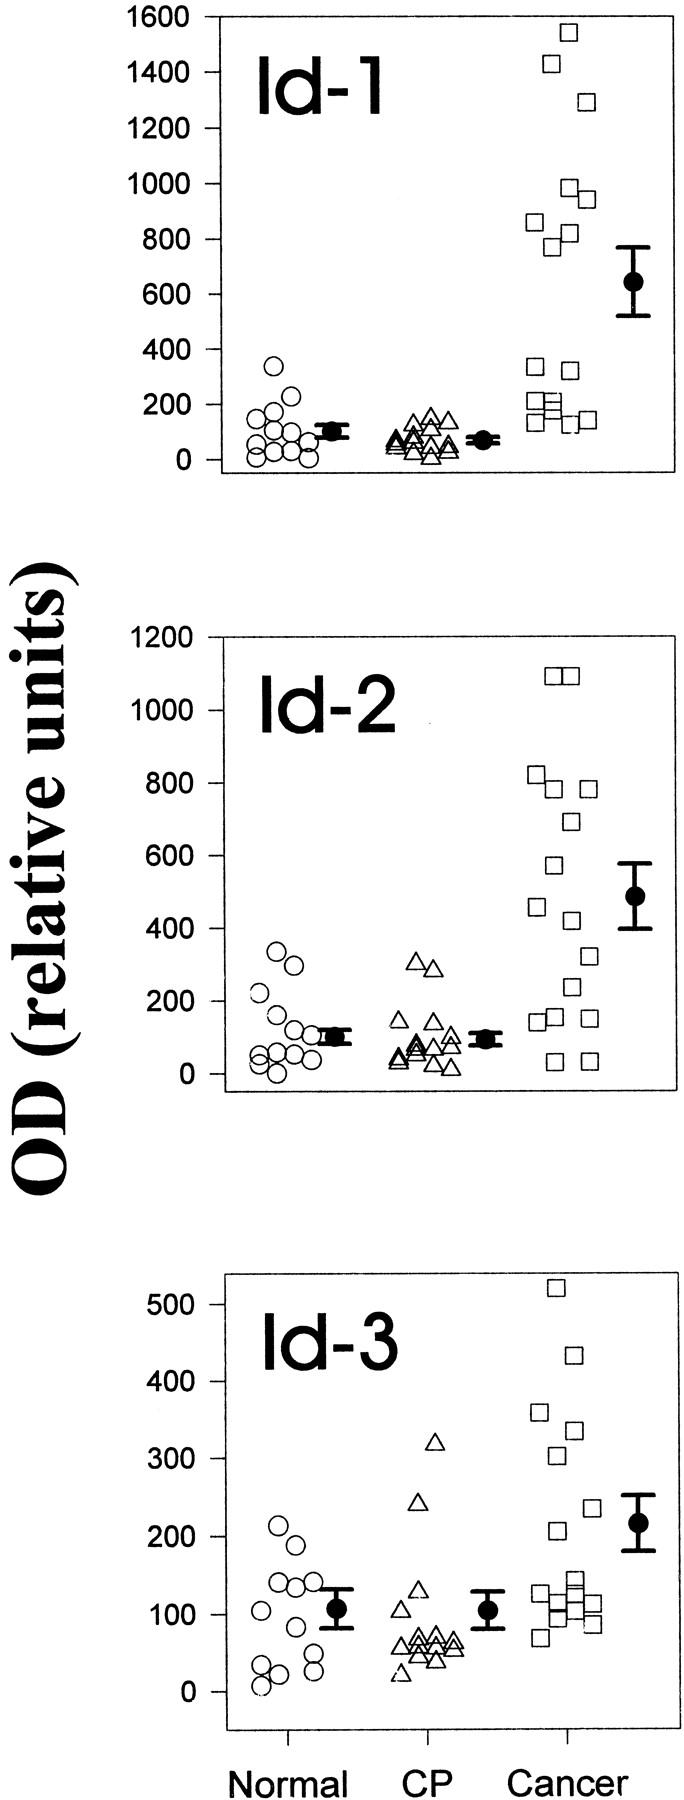
Figure 2.

Densitometric analysis of Northern blots. Autoradiographs of Northern blots from 12 normal, 14 CP, and 16 pancreatic cancers were analyzed by densitometry. mRNA levels were determined by calculating the ratio of the optical density for the respective Id mRNA species in relation to the optical density of mouse 7S cDNA. To compare the relative increase in expression of the respective Id mRNA species in the cancer and CP samples, the same normal samples were used for normal/cancer and normal/CP membranes. Normal pancreatic tissues are indicated by circles, CP tissues by triangles, and cancer tissues by squares. Data are expressed as median scores ± SD. By comparison with the normal samples, only the cancer samples exhibited significant increases: 6.5-fold (P < 0.01) for Id-1, fivefold (P < 0.01) for Id-2, and twofold (P = 0.027) for Id-3.
