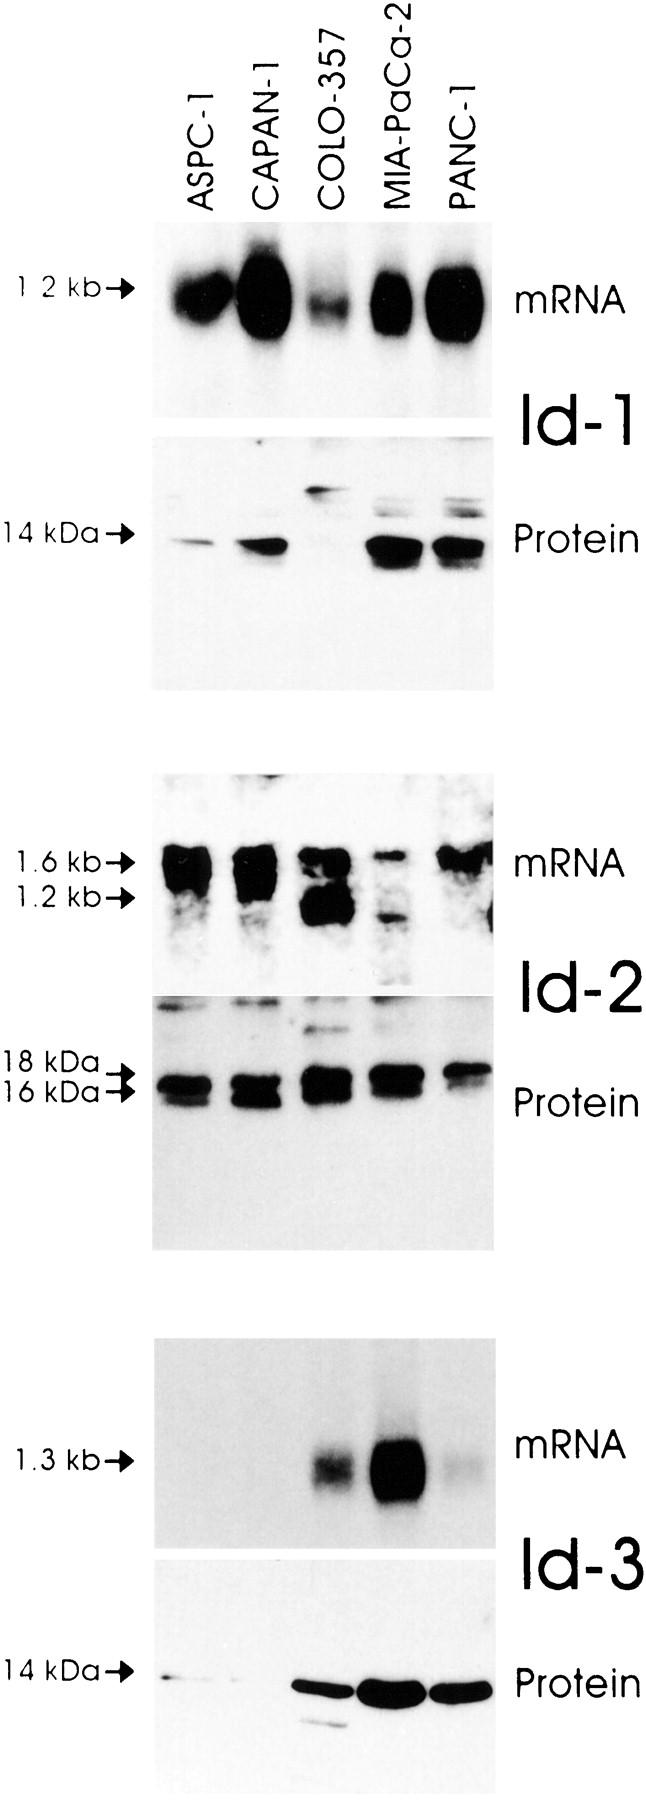
Figure 3.

Id mRNA and protein expression in pancreatic cancer cell lines. Upper panels: Total RNA (20 μg/lane) from 5 pancreatic cancer cell lines were subjected to Northern blot analysis using 32P-labeled cDNA probes (500,000 cpm/ml) specific for Id-1, Id-2, and Id-3, respectively. Exposure times were 1 day for all Id probes. Lower panels: Immunoblotting. Cell lysates (30 μg/lane) were subjected to SDS-PAGE. Membranes were probed with specific Id-1, Id-2, and Id-3 antibodies. Visualization was performed by enhanced chemiluminescence.
