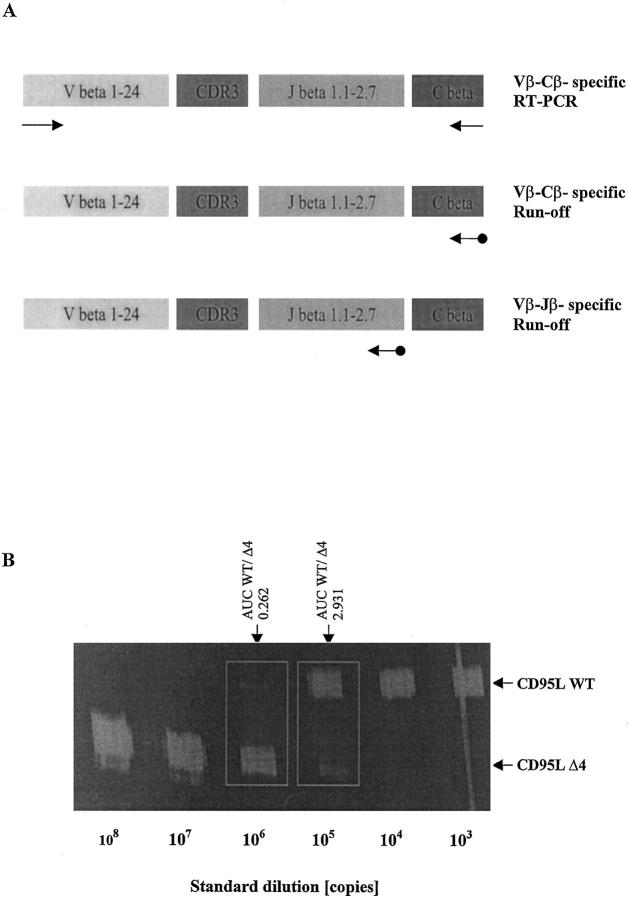
Figure 1.
A: Immunoscope-based analysis of the clonality of TCRβ VDJ-transcripts. T cell receptor β (TCRβ) transcripts are reverse transcribed and amplified using a panel of 24 Vβ- and Cβ-specific primers. Thus, the first step of the Immunoscope technique involves 24 RT-PCR reactions run to saturation (top). In an initial low-resolution analysis, a dye labeled Cβ-specific primer is used to visualize the amplified products in run-off reactions (middle). If higher resolution is required, run-off experiments are carried out using 13 dye-labeled Jβ-specific primers in theoretically 24 × 13 = 312 run-off reactions (bottom). After electrophoresis on an automated sequencer and subsequent analysis, the different size peaks are separated and their CDR3 size in amino acids (aa) and area are calculated. B: Quantification of CD95 ligand and receptor isoform mRNA levels by quantitative competitive RT-PCR. The cDNA to be assayed (WT) was co-amplified with known amounts (108, 107, … 10 3 copies) of an internal DNA standard (Δ4), which was apart from a deletion of four nucleotides identical to the corresponding fragment of the assayed cDNA. PCR products were specifically labeled in run-off reactions, loaded on an acrylamide gel, and analyzed by an automated sequencer. The fluorescent profiles were recorded and the profile areas were analyzed. For co-amplifications with 10 6 and 10 5 copies of the CD95L standard, respectively, the peak area ratios for CD95L wild-type (CD95L WT) and standard (CD95L Δ4) were calculated. The number of CD95L WT copies in the cDNA sample was calculated as the mean of CD95L WT/CD95L Δ4 peak area ratios at two standard dilutions (eg, for the sample shown here: (0.262 × 10⁶ + 2.931 × 10⁵)/2, or 277,550 copies).

