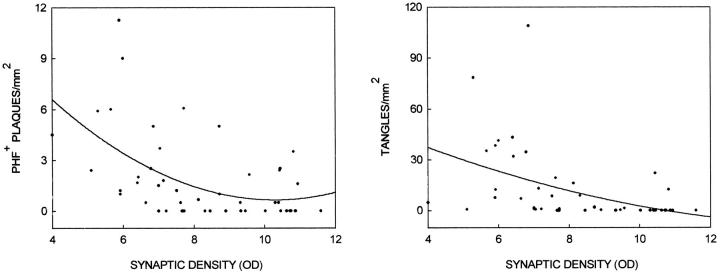
Figure 4.
Synaptic density estimates from synaptophysin Western blot analysis as a function of entorhinal cortex and superior frontal gyrus paired helical filament immunoreactive (PHF+) plaques/mm 2 (left panel) or thioflavin histofluorescent tangles/mm 2 (right panel). Data points for ND, HPC, and AD patients are included.

