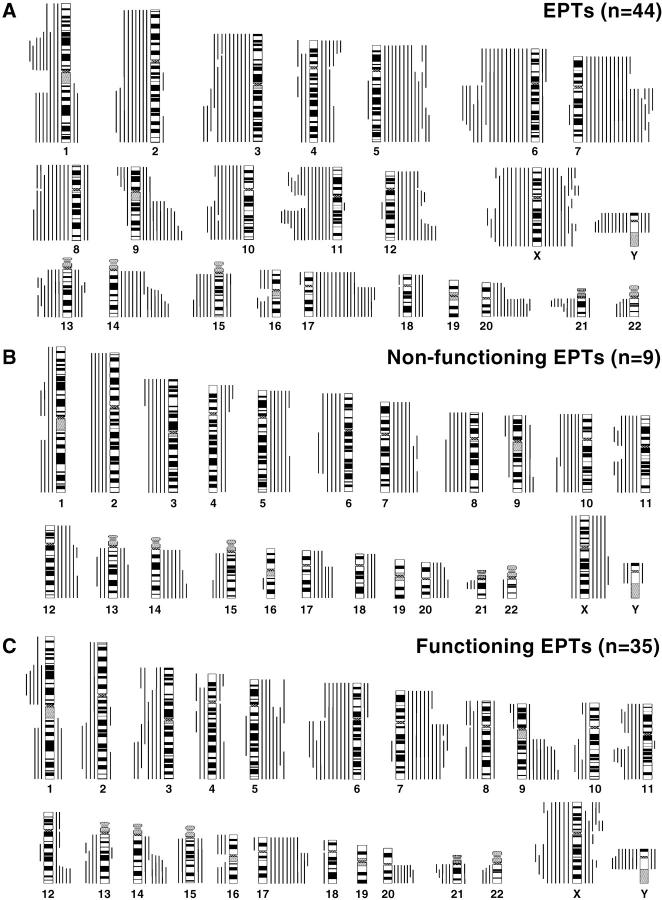
Figure 1.
Summary of all DNA copy number changes detected by CGH in all 44 EPTs (A), 9 nonfunctioning EPTs (B), and 35 functioning EPTs (C). The vertical lines on the right of the chromosome ideograms indicate gains of the corresponding chromosomal regions; those on the left indicate losses. Gains on 1p, 16p, 19, and 22 were not analyzed.

