
Figure 2.
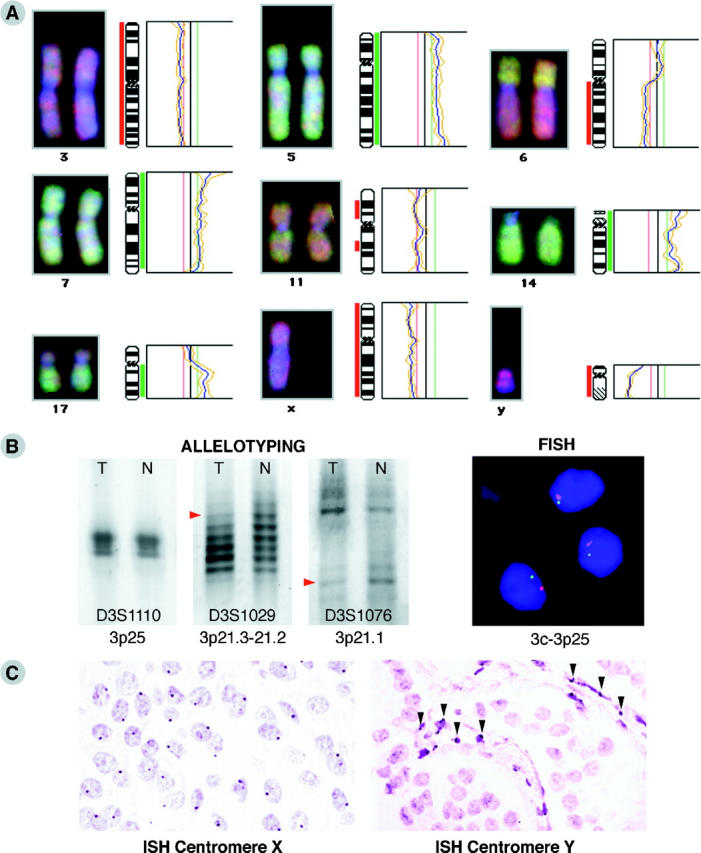
A: Representative CGH results in EPTs. Individual examples of fluorescent ratio profiles (right) and digital images (left) of chromosomes with recurrent gains and losses. The red vertical bar on the left side of a chromosome ideogram (middle) indicates the region of loss and the green vertical bar on the right side of an ideogram indicates the region of gain. B: Example of microsatellite and FISH LOH analysis of a nonfunctioning EPT shows allelic loss for 2 of 3 markers (D3S1029 and D3S1076, red arrowheads; D3S1110 is not informative) on chromosome arm 3p (left) and monosomy for both the centromere 3 (red spots) and 3p25-specific probe (green spots) in DAPI-stained tumor nuclei (right). C: Example of in situ hybridization analysis on paraffin sections of a male VIPoma sample, showing the expected one copy of the X centromere per nucleus in the major cell population (left) and a loss of the chromosome Y centromere sequence in the tumor cells, whereas the stroma cells in between (arrowheads) are still positive for this DNA sequence (right).