
Figure 2.
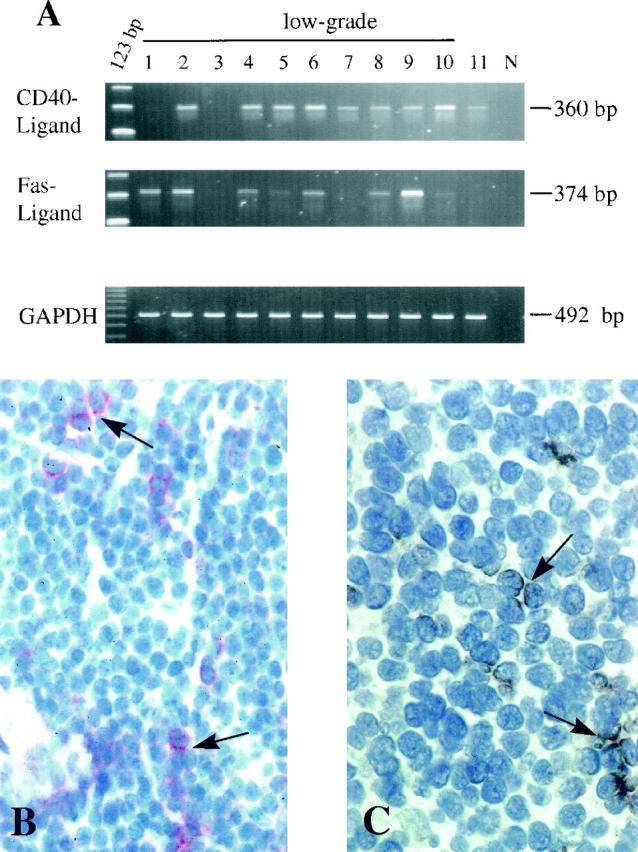
CD40-ligand and Fas-ligand expression in MALT tumor tissues in vivo. A: A semiquantitative RT-PCR with GAPDH as standard. N, negative control. B: Immunohistochemical detection of scattered CD40-Ligand expressing cells within the low-grade tumor infiltrate (no. 6; arrow; APAAP, cryostat section, ×250). C: Fas-ligand expression in the same tissue, giving brown spotted signals (no. 6; arrow; PAP, peroxidase-anti-peroxidase; cryostat section, ×400).