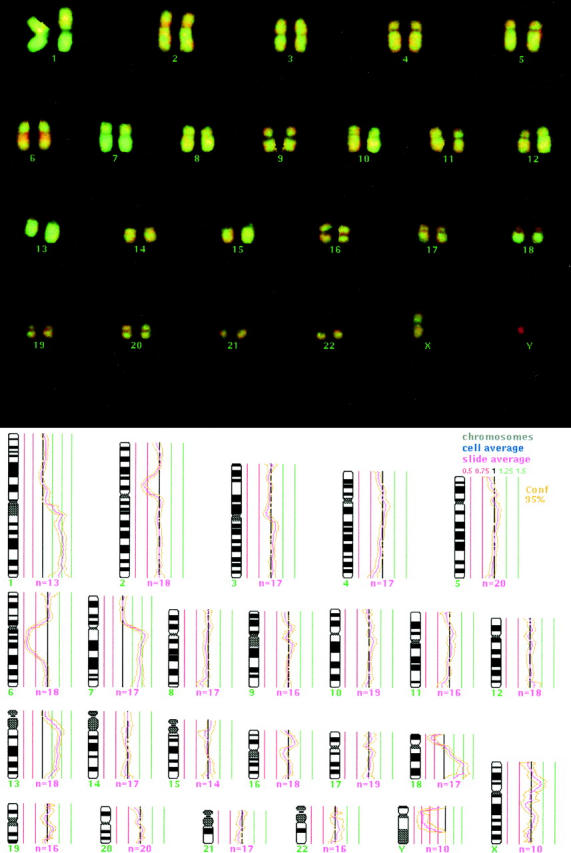
Figure 2.

Two-color CGH image of hybridized chromosomes of case 15 with computer-generated CGH ratio superimposed. Green regions represent gains, red regions losses (top). Calculated CGH profile shows gains on 1q, 7q, 13q, and 18q as well as losses on 2p, 6q, und 18p. Average ratio profile of autosomal chromosomes is depicted with a 95% confidence interval. The ratios are plotted alongside the chromosome ideogram. A balanced copy number has a baseline ratio of 1, represented by the central black line; thresholds of copy number gains (1.25) and losses (0.75) are shown (bottom).
