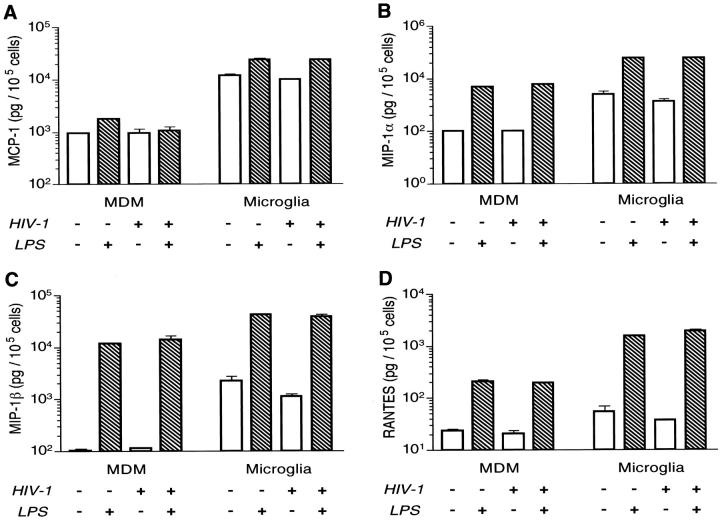
Figure 2.
Production of chemokines by microglia and MDM. Adherent MDM and microglia were cultured on 96-well plates at a density of 10 5 and 5 × 10 4 cells/well, respectively, for 7 days before infection with HIV-1ADA at multiplicity of infection of 0.1. Replicate microglia and monocytes were stimulated with LPS (1 g/ml), and culture fluids from infected or uninfected cells were collected 24 hours later. The MCP-1 (A), MIP-1α (B), MIP-1β (C), and RANTES (D) were assayed using the Quantikine ELISA kits (R&D Systems). The levels of chemokines were normalized to cell numbers by measuring cell viability at the end of the sample collection by the MTT assay. The normalized values of chemokines per 10 5 cells were used to perform statistical analysis by the two-tailed Student’s t-test. Data presented in a log scale (mean ± SE) are from one of two independent experiments. Comparison of microglia- versus MDM-treated similarly yielded statistically significant differences (P < 0.0001).

