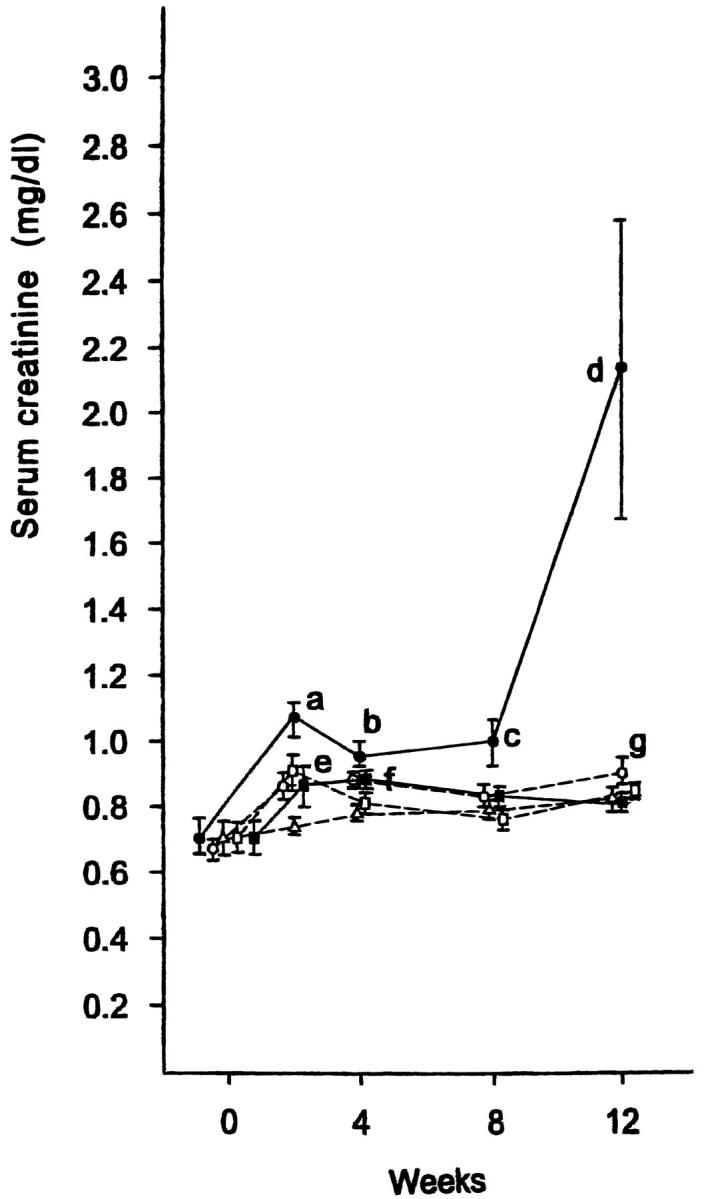
Figure 3.

Serum creatinine concentration after microsphere injection. Groups of rats were: (-Δ-) group 1, control; (-•-) group 2, 0.8 mg of microspheres; (-○-) group 3, 0.4 mg of microspheres; (-▪-) group 4, 0.2 mg of microspheres; (-□-) group 5, 0.1 mg of microspheres. a, b, and f: P < 0.01 vs. the value before injection (0 weeks) and group 1; c: P < 0.05 vs. group 1, P < 0.01 vs. 0 weeks; d: P < 0.05 vs. groups 1, 3, 4, and 5, P < 0.01 vs. 0 weeks; e: P < 0.05 vs. 0 weeks; g: P < 0.01 vs. 0 weeks.
