
Figure 3.
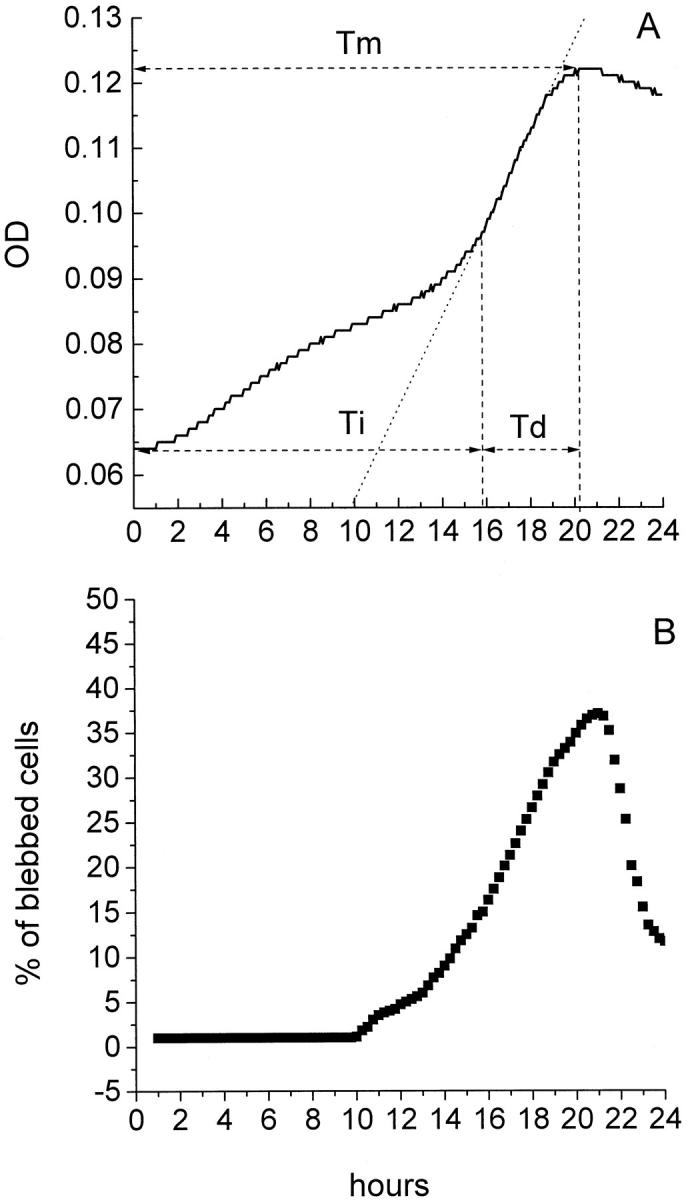
Comparison of the MiCK assay and TLVM of HL-60 cells exposed to cisplatin. HL-60 cells were cultured with 5 μmol/L cisplatin in complete medium for 24 hours. The cell cultures were analyzed by (A) MiCK assay for changes in OD and (B) the TLVM for percentages of blebbed cells. In A, time to the maximum apoptotic response (Tm), initiation time (Ti), development time (Td), and best fit line (dotted line) of the rapidly increasing portion of the OD-versus-time curve are shown. Results of one representative experiment of three performed are presented.