
Figure 10.
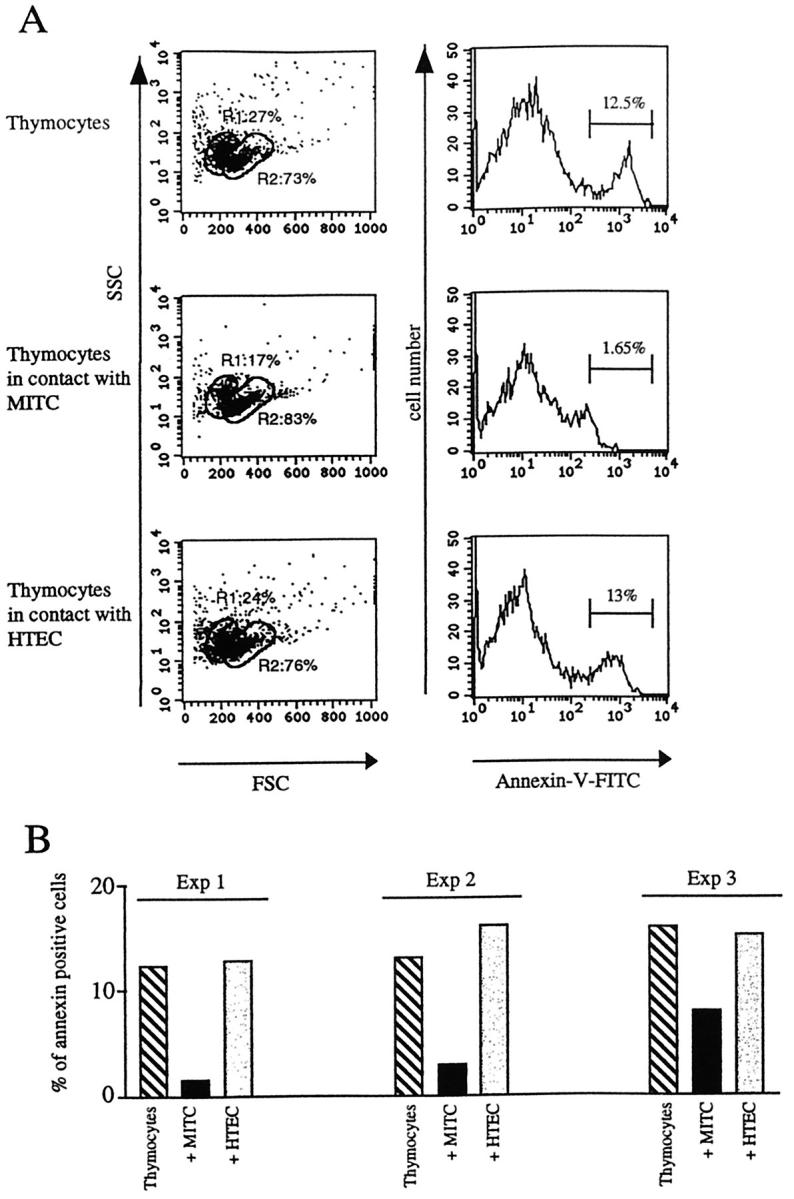
Analysis of apoptotic thymocytes. FCS/SSC parameters define two gates: R1, which contains cells that are mainly apoptotic cells, and R2 which contains cells that are mainly living cells. When thymocytes are co-cultured with MITC, the ratio R1/R2 is decreased. Annexin V FITC staining in thymocytes alone or co-cultured with MITC or HTEC indicates the percentage of apoptotic thymocytes. In the presence of MITC the percentage of annexin V-positive cells is reduced. A: One representative experiment. B: Results obtained from three independent experiments.