
Figure 5.
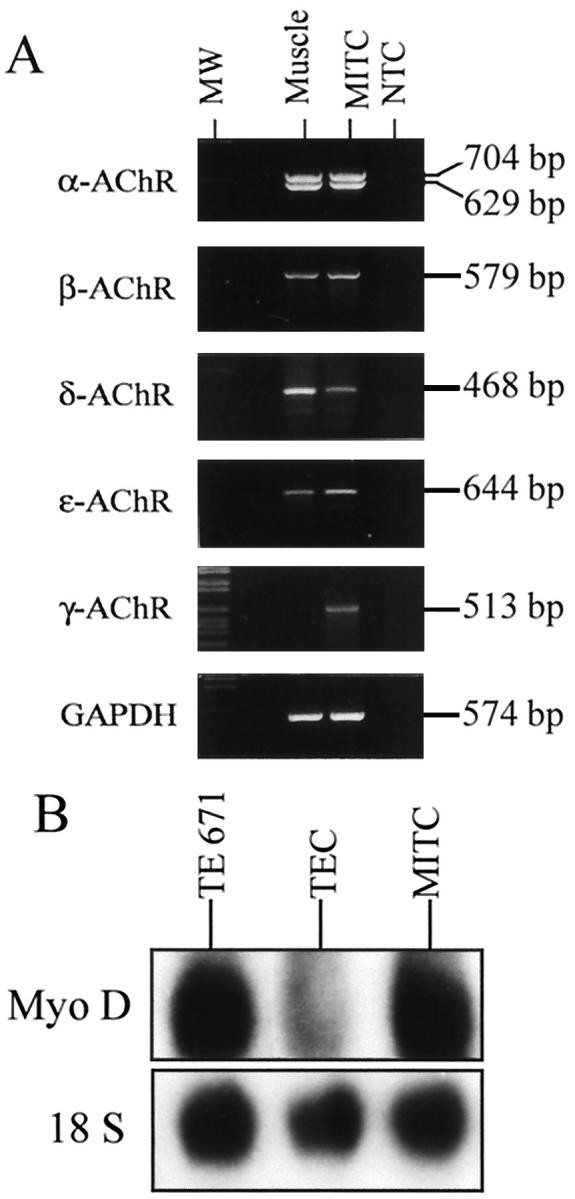
Expression of AChR subunits and MyoD factor in MITC cells. A: Amplification of the extracellular region of the α-subunit with primers A1 and A2 (704 and 629 bp for the P3A+ and P3A− isoforms, respectively), the β-subunit with primers D1 and D2 (579 bp), the γ-subunit with primers E1 and E2 (513 bp), and the ε-subunit with primers F1 and F2 (644 bp); GADPH was used to check RNA quality (574 bp). Muscle was used as a positive control. B: Expression of myogenic MyoD factor in MITC analyzed by Northern blotting.