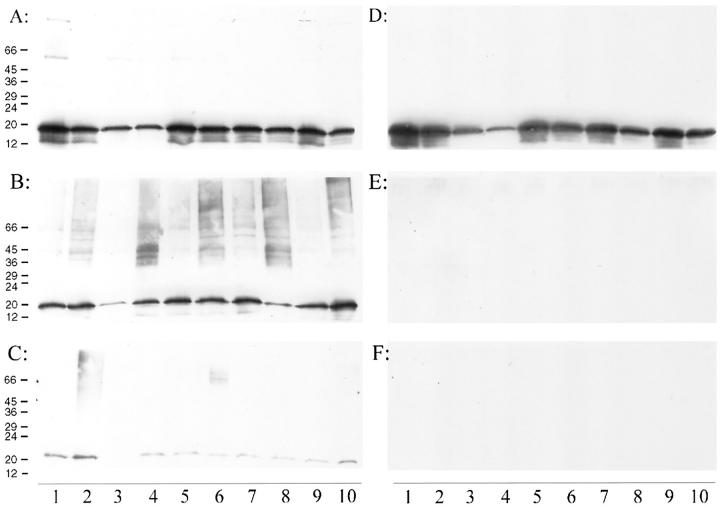
Figure 6.
Regional distribution of α-synuclein immunoreactivity with respect to brain fractions in a single MSA (A, B, and C) and a normal individual (D, E, and F). The fractions are as follows: S2 + S3 (A and D); S4 (B and E) and S5 (C and F). The anatomical regions and number of GCI (± SE) in the MSA cases are as follows: Lane 1: amygdala (1.7 ± 0.9); Lane 2: hippocampus (1.7 ± 0.9); Lane 3: corpus callosum (31.3 ± 3.3); Lane 4: thalamus (22.7 ± 2.1); Lane 5: cingulate cortex (11.3 ± 1.7); Lane 6: striatum (180 ± 17); Lane 7: temporal cortex (1.7 ± 1.3); Lane 8: globus pallidus (134 ± 31); Lane 9: insular cortex (1.7 ± 0.9); Lane 10: frontal cortex (3.7 ± 0.5).

