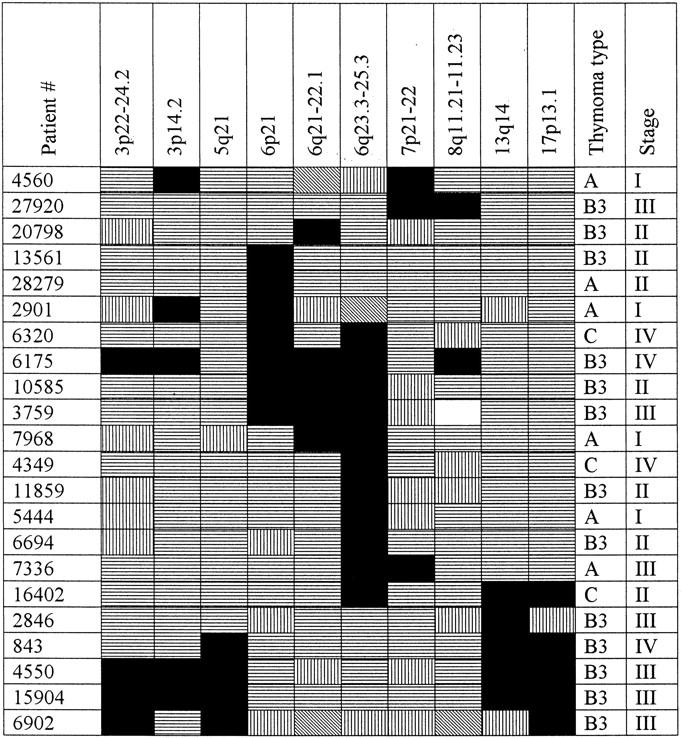
Figure 3.

Pattern of genetic aberrations in thymic epithelial tumors. Microsatellite analysis results for 10 chromosomal regions harboring at least three allelic imbalances are displayed. Patients showing at least one aberration are listed in the first left column. Status of each locus is indicated: black, LOH; horizontal stripes, retention of heterozygosity; falling stripes, no amplificate; vertical stripes, homozygosity; and white, genomic amplification.
