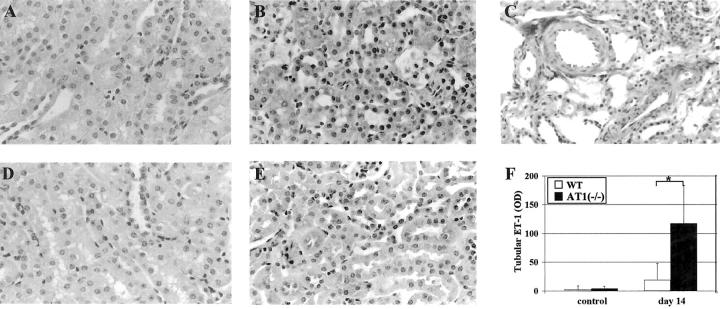
Figure 8.
AT1(−/−) show higher ET-1 protein expression than WT in tubular epithelial cells and connective tissue around small vessels. AT1(−/−) with moderate overload nephropathy at day 14 showed a significantly higher expression of ET-1 in tubular epithelial cells (A, control; B, nephropathy) and also in connective tissue around small vessels (C) than WT (D, control; E, nephropathy). The computer analyses of the data are shown in F (117 ± 67 versus 19 ± 29 OD, n = 6, *P < 0.01). Immunohistochemistry; original magnifications, ×100.

