
Figure 1.
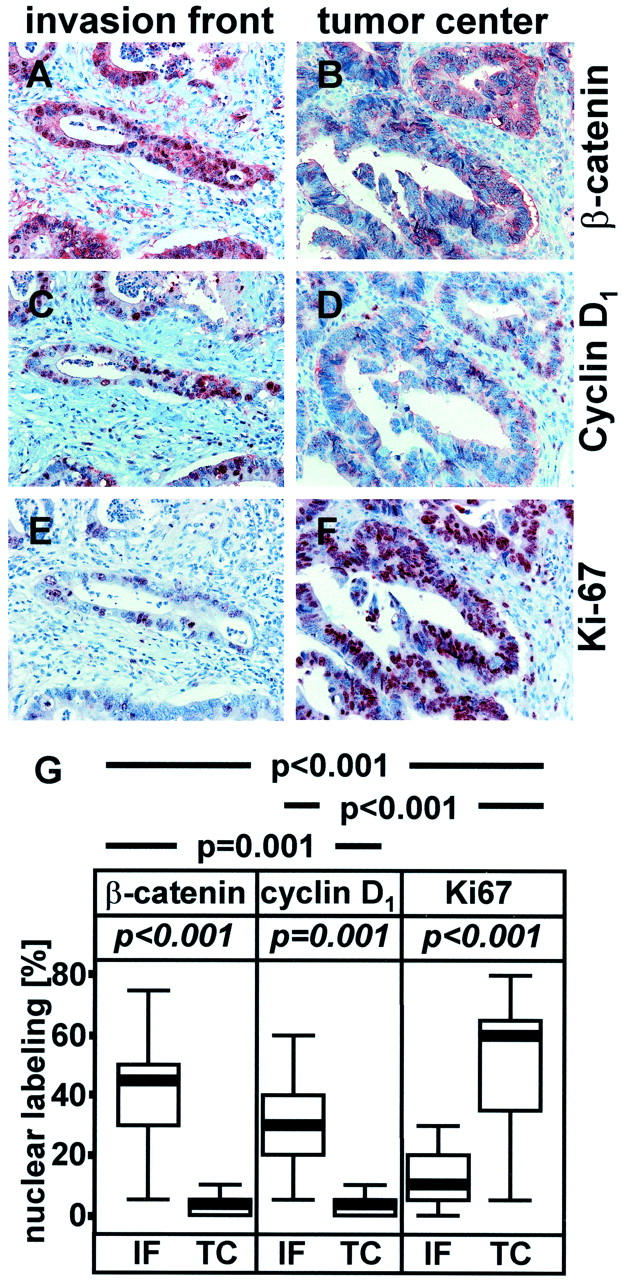
Areas taken from the invasion front (A, C, E) and central parts of the tumor (B, D, F) from the same tumor stained immunohistochemically with antibodies directed against β-catenin (A, B), cyclin D1 (C, D), or Ki-67 (E, F). As serial sections were used comparable tumor regions are shown. G: Statistical analysis of immunohistochemical staining data. Nuclear labeling: rounded percentage value of cells showing nuclear localization (rounding was done in 5% steps); IF, invasion front; TC, central parts of the tumor; p-value (Mann-Whitney test) for correlating location (IF versus TC) with expression of β-catenin, cyclin D1, or Ki-67; p-value, χ 2 test (Fisher’s exact test) for correlating co-localization of antigen pairs: β-catenin/Ki-67, cyclin D1/Ki-67, β-catenin/cyclin D1.